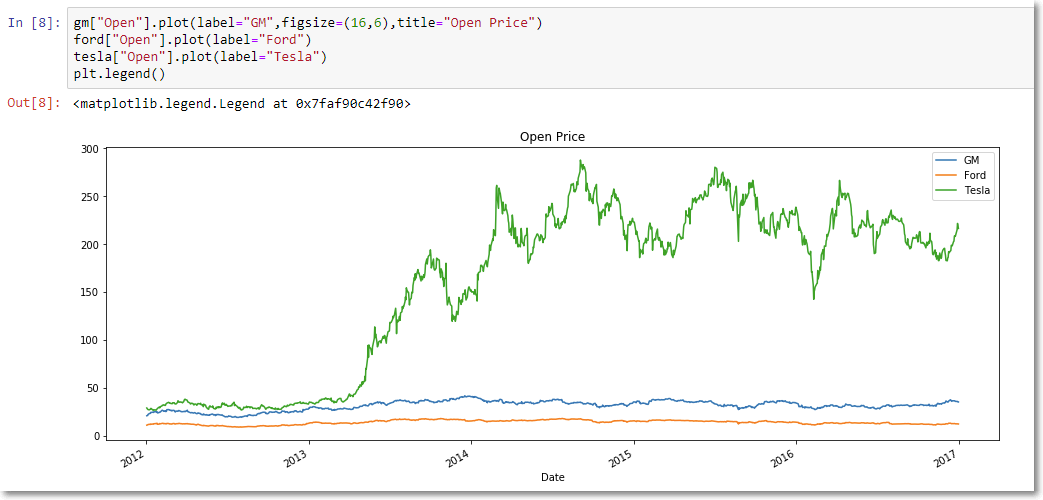
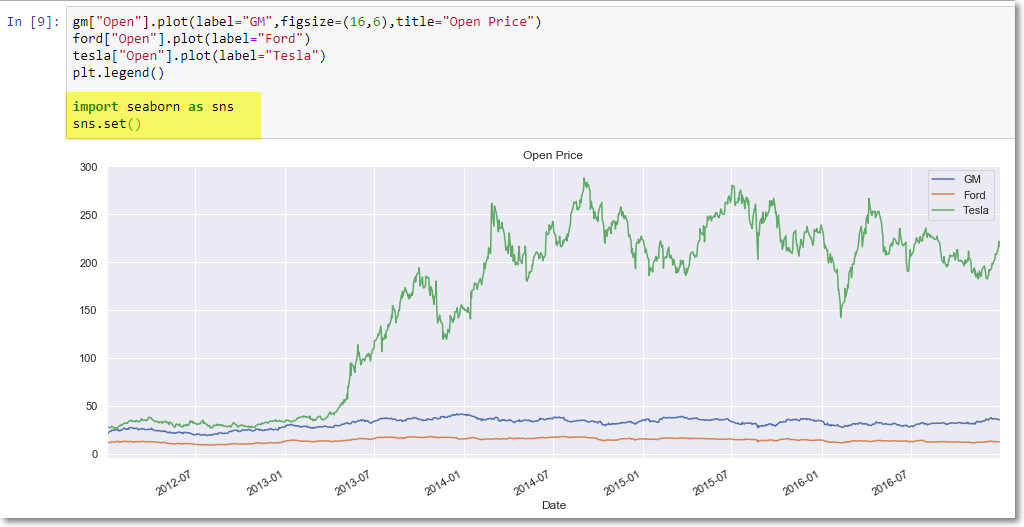
What I Learnt Today - 2 Lines of Code to Transform Matplotlib Charts Mar 21, 2020 Simply adding 2 lines of code to your notebook will change basic MatplotLib Charts from this: to this: And that’s done by adding these 2 lines: import seaborn as sns sns.set()